What Does RAND 3.0 Mean for Employers?


In a step forward for healthcare transparency, the RAND Corporation recently published a landmark study on commercial hospital prices across the US. It’s their third study on the topic, but it breaks new ground, covering almost every state and even naming particular hospitals. While the complete results will surely interest anyone involved with healthcare transparency, we thought it would be worth pointing out two key takeaways for employers – plus an observation on what is missing from the study.
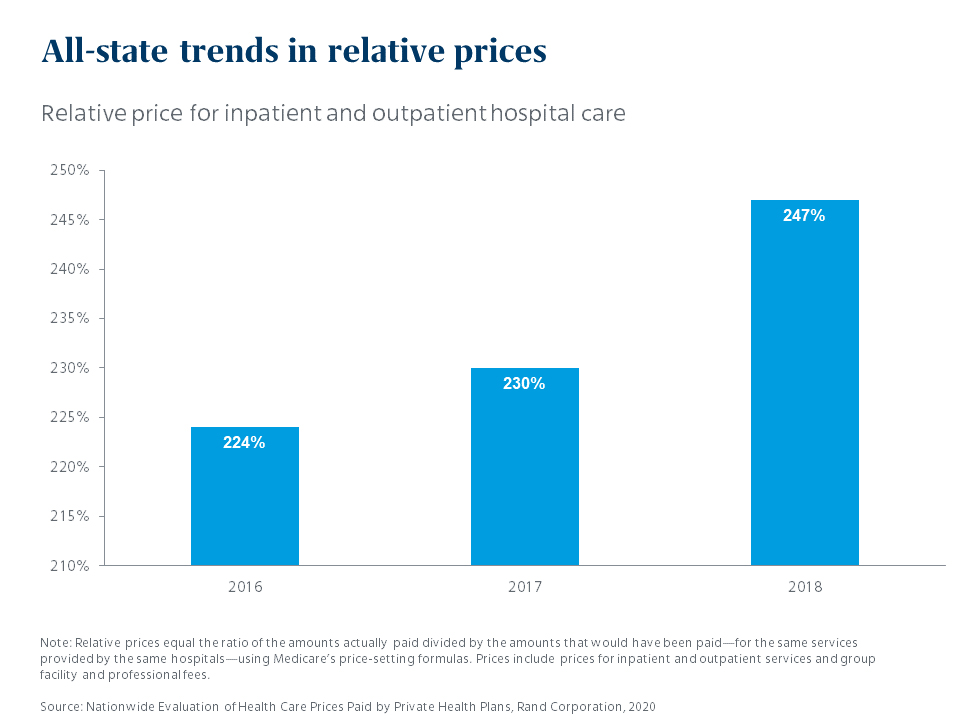
The gap between commercial payers and Medicare is wide – and growing
Ok, the first part of that statement isn’t news. Employers have long known that they pay far more for the same services than Medicare does. But what is news is that the gap is growing. In 2016, hospitals charged private health plans 224% of Medicare reimbursement levels; in 2018, they charged 246% of Medicare. Relative to Medicare rates, commercial rates rose by 10% in just two years.
Hospitals maintain that they need to charge commercial payers more to compensate for the amount of lower-paying Medicare business they take. But the study had a startling finding related to this long-standing claim. The RAND researchers found there was almost no relationship between the amount of Medicare business a hospital has and the amount they charge commercial payers. Reading between the lines, one would conclude that hospitals are charging whatever the market will bear.
There’s no economic reason to think this trend will start going in the other direction – which underscores the need for employer-sponsored plans to be vigilant in their use of cost control mechanisms.
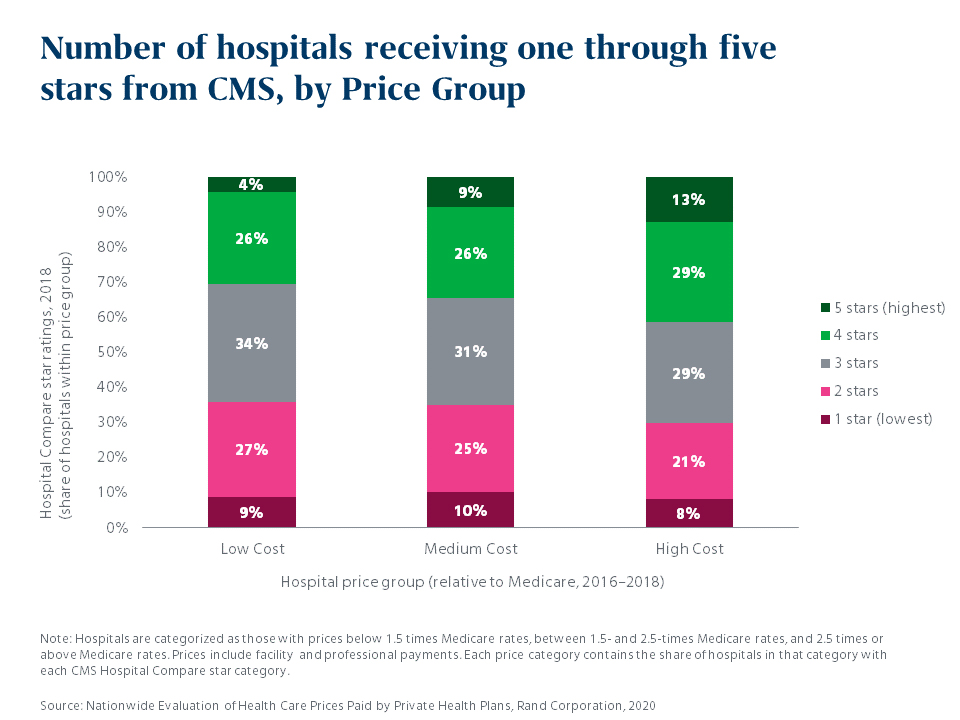
There’s some correlation between price and quality – but not much
The study also turned its attention on quality for the first time, using CMS star ratings and Leapfrog grades to categorize hospitals according to quality. There were slightly more hospitals with 4- and 5-star ratings in the high-cost bucket, suggesting a small correlation. But over a third of the hospitals in the low-cost bucket had high quality ratings, and there was little difference between the low- and high-cost buckets in the percentage of hospitals with low quality ratings.
What’s missing: The power of the pen
This is fascinating information, but it leaves us wanting more. CMS star ratings are presented at the facility level. Some of these facilities are massive, employing hundreds of doctors who work in similar care categories – and some consistently produce better outcomes than others. Further, physicians order everything that a patient receives in a hospital – and some are more likely to order wasteful or inappropriate care than others. So getting to quality ratings at a physician level matters.
Based on Mercer’s QualPic tool, we know that there is significant variation in quality among providers even within the same facility, and that a hospital-level metric may not tell you whether you’re getting the best value for your healthcare spending. We are using QualPic to engage and inform our clients about this so that we can begin to drive meaningful, value-enhancing change, together.
How much do you know about the quality of the facilities and providers your employees and their families are using? Knowledge is power; Take our quick quality quiz – here.
The RAND study has only been out for a few weeks, but we have already begun using the findings to inform our thinking and to enhance the solutions we offer employers. We believe this important study will help advance new ways of leveraging employer purchasing power to drive greater value in the healthcare market.